


 18 / 52

KONE 2016 | SUSTAINABILITY REPORT
ENVIRONMENT - OPERATIONS
18
KONE’s operational environmental work
focuses on reducing our carbon footprint and
improving energy and material efficiency,
lowering our water consumption and waste
amounts, and minimizing our use of hazardous
substances. We work with our suppliers and
customers to avoid greenhouse gas emissions
and other adverse environmental impacts
from our business operations whenever
possible. (See p. 7 Key figures for our 2016
environmental data.)
In 2016, KONE’s absolute operational carbon
footprint increased by 0.2%. This slight
increase can be attributed to the growth in our
employee numbers and sales increase as well
as adding some 500 corporate benefit vehicles
to the reporting scope during the year. KONE’s
operational carbon footprint relative to net sales
decreased by 4.1% with sales growth calculated
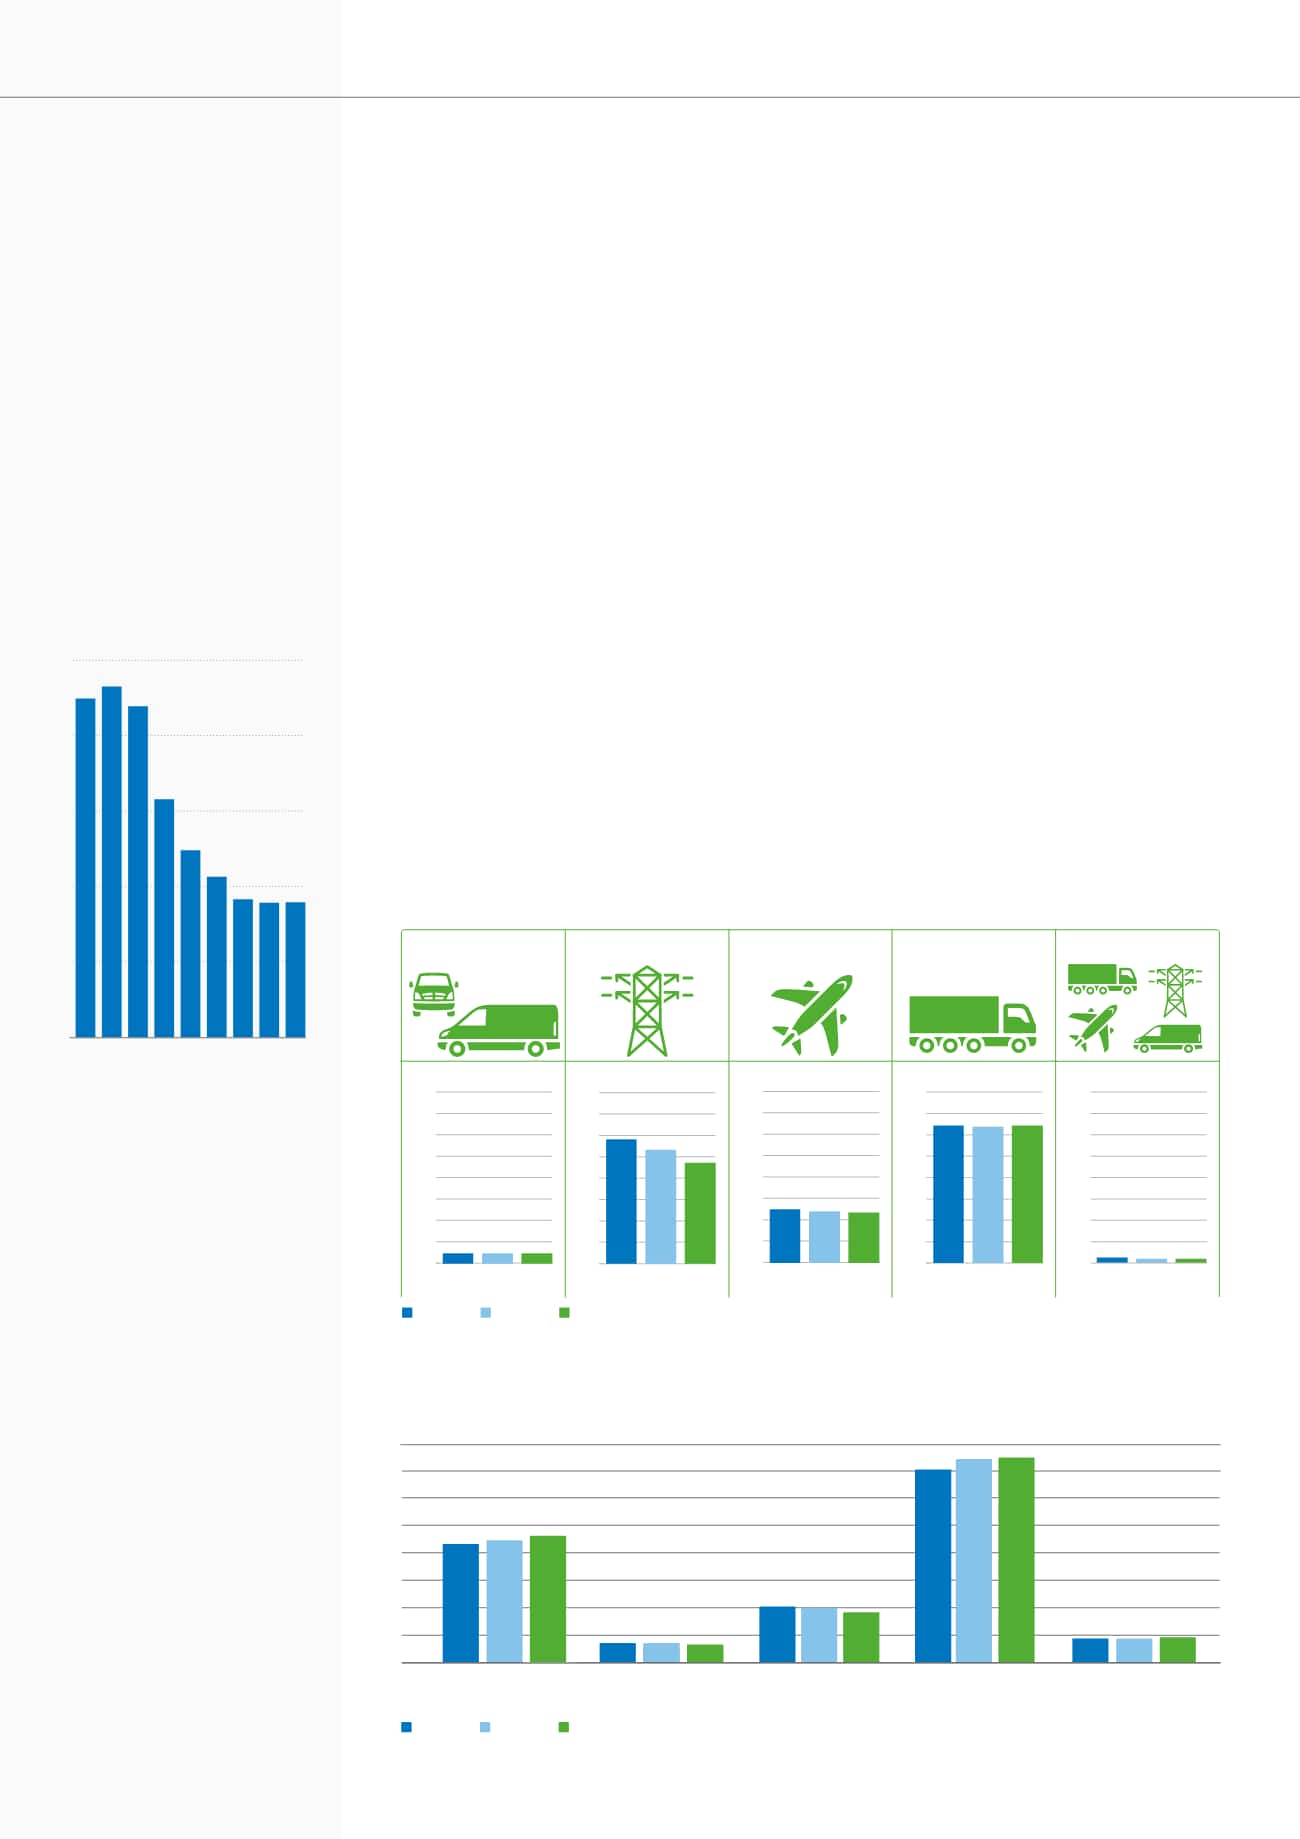
THE ENVIRONMENTAL IMPACT OF KONE’S
OPERATIONS IN 2016
at comparable exchange rates (1.9% at historical
exchange rates). During the year, the absolute
operational carbon footprint of externally assured
scope 1 and scope 2 greenhouse gas emissions
decreased by 0.6%. The scope 1 and 2 carbon
footprint relative to net sales decreased by 5.4%
with sales growth calculated at comparable
exchange rates (3.3% at historical exchange
rates).
Logistics operations were the major source of
greenhouse gas emissions in KONE’s absolute
carbon footprint, accounting for 149 ktCO
2
e
(2015: 148). Other significant contributors
were our vehicle fleet at 92 ktCO
2
e (2015: 89),
electricity/district heat consumption at
37 ktCO
2
e (2015: 40), business air travel at 19
ktCO
2
e (2015: 18), and fuels for heating and
cooling, which added to the total by 13 ktCO
2
e
(2015: 14).
149
2014
2015
2016
160
140
120
100
80
60
40
20
0
Vehicle fleet
Heating fuels and
cooling gases
Electricity and
district heat
Logistics
92
13
37
86 89
14 14
40
41
141
148
Business air travel
19
18 18
Absolute operational carbon footprint per category, ktCO
2
e
Data assured externally
1,200
1,050
900
750
600
450
300
150
0
1,200
1,050
900
750
600
450
300
150
0
Relative operational carbon footprint
Data assured externally
kgCO
2
e / Unit in service
kgCO
2
e / Headcount
kgCO
2
e / Headcount
kgCO
2
e / Unit
tCO
2
e / MEUR Sales
Vehicle fleet
(Scope 1)
Electricity (Scope 2)
Business air travel
(Scope 3)
Logistics (Scope 3)
Overall operations
2014
2015
2016
73.5 71.4 71.4
1,200
1,050
900
750
600
450
300
150
0
870
800
708
380 362 357
1,200
1,050
900
750
600
450
300
150
0
961 958 967
41.2
35.9
35.2
1,200
1,050
900
750
600
450
300
150
0
REDUCING OUR LONG-TERM
CARBON FOOTPRINT
KONE has been measuring its
operational carbon footprint since
2008. Between 2008 and 2016, we
have succeeded to reduce our Scope
1 and 2 carbon footprint relative to
orders received by over 60%.*
Scope 1 and 2 carbon footprint,
kgCO
2
relative to orders received.
2,500
2,000
1,500
1,000
500
0
*Calculations include Scope 1 direct
energy (heating/vehicle fleet fuels),
cooling gases, and scope 2 indirect
energy (electricity/district heat).
09 10 11 12 13 14 15 16
08