


 7 / 50

KONE 2015 | SUSTAINABILITY REPORT
KEY FIgURES 2015
7
Energy consumption
Units 2013 2014 2015
Direct
Heating and vehicle fleet fuels
(heating oil, natural gas, petrol, die-
sel, biodiesel; biodiesel consump-
tion was 9,000 MWh in 2014/2015)
MWh
403,500 390,400 399,100
Indirect
Electricity*
MWh
78,300
79,900 79,800
District heat
MWh
15,000
15,900 15,100
*2014 restated
Carbon footprint of KONE’s operations, tCO
2
e
2013 2014 2015
Direct (scope 1)
Vehicle fleet*
86,200
85,800 88,500
Heating fuels*
12,800
9,900
9,300
Cooling gases
1,000
1,400
1,900
Indirect electricity
(scope 2)
Electricity consumption
(including district heat)**
44,100
40,900 39,700
Other relevant
indirect (scope 3)
Logistics***
129,100 138,200 148,000
Business air travel
17,200
17,900 17,100
Waste
1,900
2,300
2,500
Total
292,300 296,400 307,000
* 2014 restated **2014 restated; calculated using market-based method ***2013 and 2014 restated
Waste, tonnes
2013 2014 2015
Recycled waste*
18,500
16,900 16,000
Incinerated waste
1,800
2,200
2,200
Landfill waste*
2,700
2,700
3,000
Hazardous waste**
700
800
800
Total
23,700
22,600 22,000
*2013 and 2014 restated **2014 restated
Water consumption
2013 2014 2015
Total
m
3
370,000 390,000 390,000
Scope 1, scope 2, and scope 3 logistics and business air travel data assured by Mitopro Oy
1,200
1,050
900
750
600
450
300
150
0
1,200
1,050
900
750
600
450
300
150
0
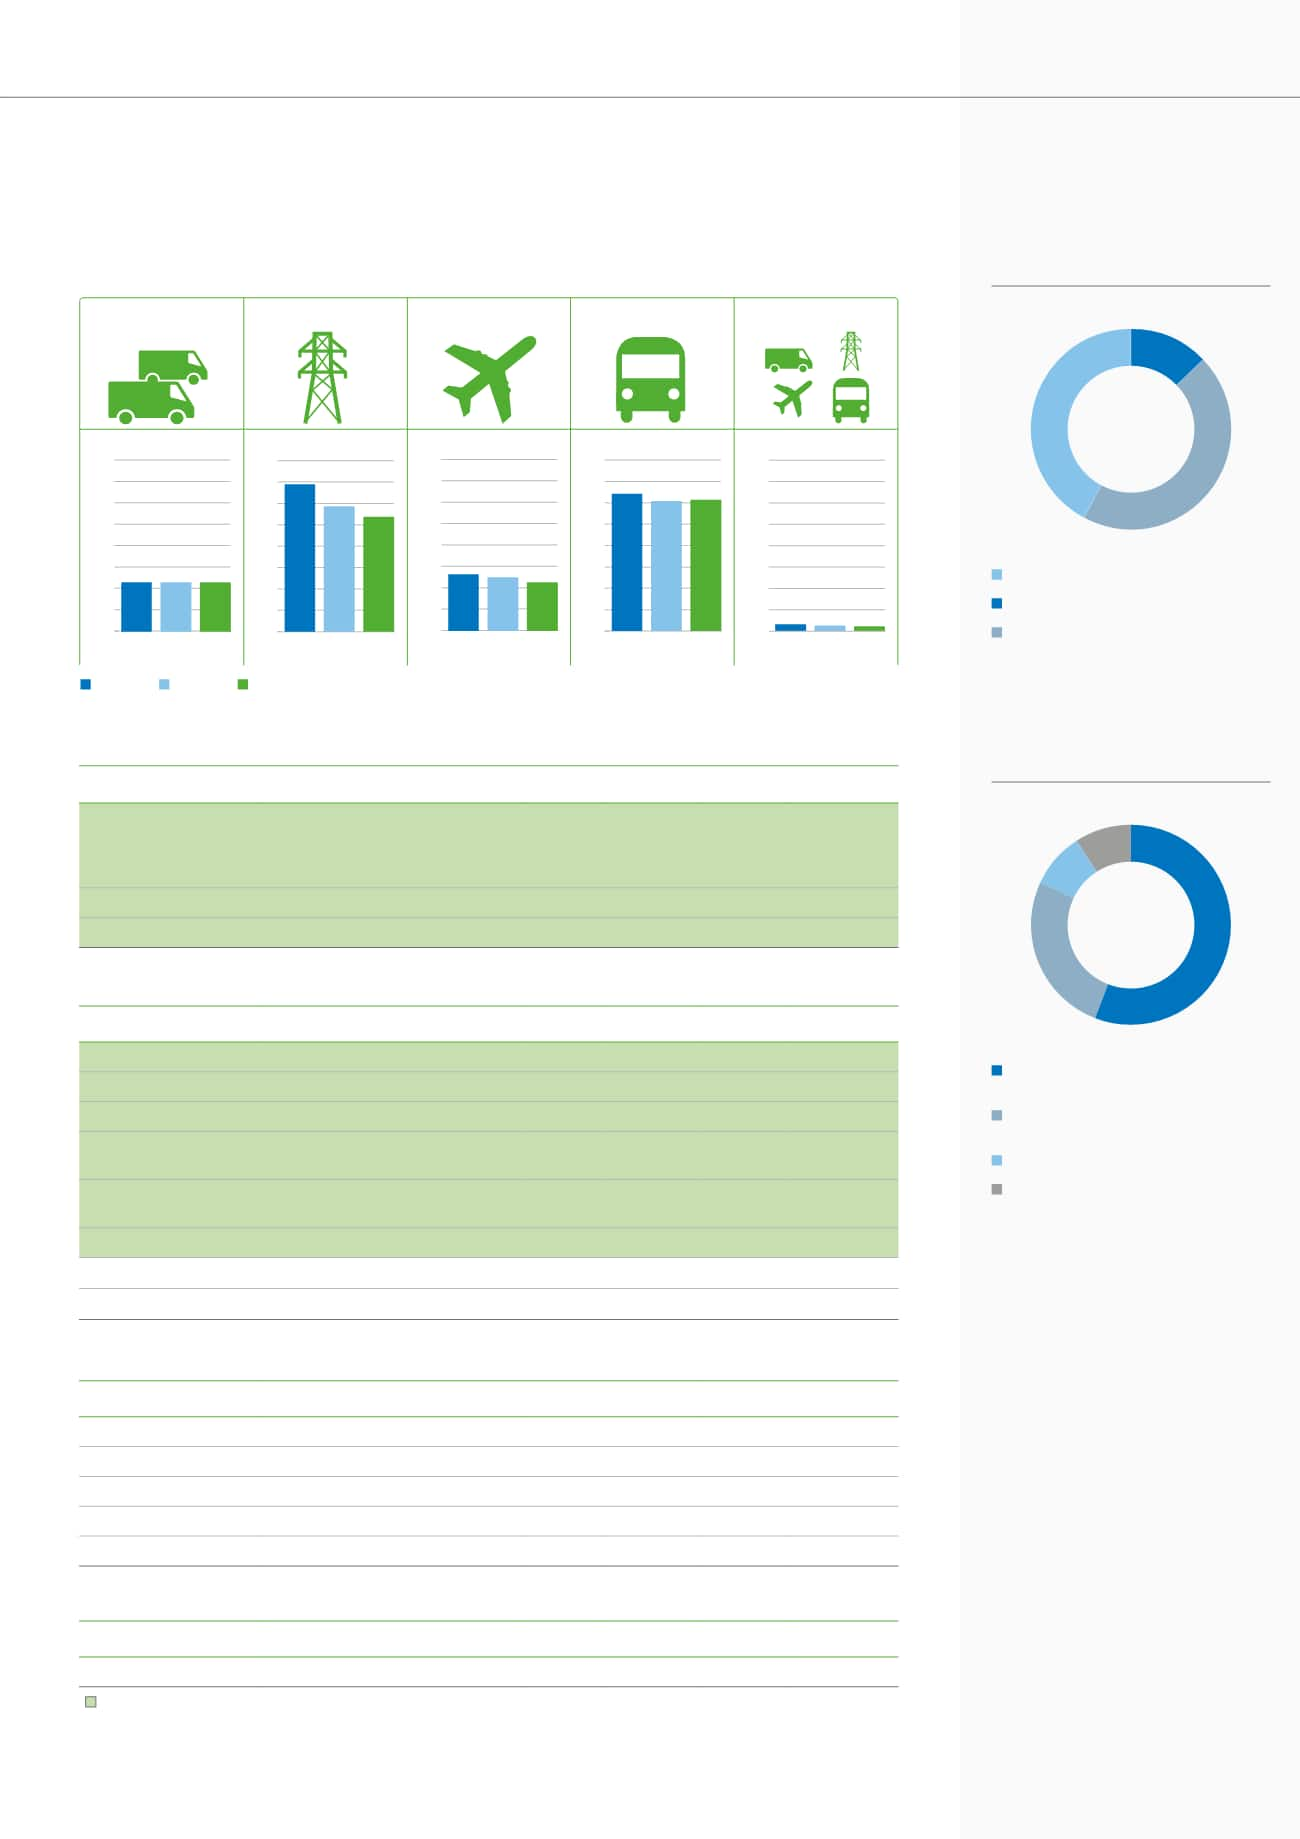
Relative operational carbon footprint
Data assured externally
kgCO
2
e / Unit in service
kgCO
2
e / Headcount
kgCO
2
e / Headcount
kgCO
2
e / Unit
tCO
2
e / MEUR Sales*
Vehicle fleet
(Scope 1)
Electricity (Scope 2)
Business air travel
(Scope 3)
Logistics (Scope 3)
Overall operations
2013
2014
2015
-5.0% -2.9%
-4.3% -9.5%
77.4 73.5 71.4
1,200
1,050
900
750
600
450
300
150
0
1,018
869
798
397 380 344
-5.6% +1.0%
1,200
1,050
900
750
600
450
300
150
0
965 911 920
-4.3% -12.1%
42.2
40.4
35.5
1,200
1,050
900
750
600
450
300
150
0
-8.2%
-14.6%
*4.4% reduction in 2015 with sales growth calculated at comparable exchange rates.
Employees by market, 2015
EMEA: 42% (44%)
Americas: 13% (12%)
Asia-Pacific: 45% (44%)
(2014 figures in brackets)
13%
42%
45%
Employees by job category, 2015
Maintenance and modernization
56% (56%)
New equipment, sales and
installation 26% (26%)
Manufacturing 9% (10%)
Administration, IT and R&D 9%
(8%)
(2014 figures in brackets)
56%
26%
9%
9%