


 39 / 52

KONE 2016 | SUSTAINABILITY REPORT
ECONOMIC RESPONSIBILITY
39
in terms of sales. In 2016, China’s share was
approximately 30%, the United States’ share
was approximately 15%, while France and
Germany accounted for approximately 5% of
total net sales each. KONE’s operating income
(EBIT) continued to grow, reaching EUR
1,293 million (2015: 1,241 MEUR) or 14.7%
(14.4%) of net sales in 2016. Operating income
grew, driven by positive development in all
businesses. The growth was driven by broad-
based positive development across geographic
regions, in particular in Europe and North
America. Unfavorable translation exchange rates
burdened the growth in operating income with
a negative impact of EUR 44 million. KONE’s
financial position was strong at the end of
December 2016. The cash flow generated from
operations during January–December 2016
before financing items and taxes was strong at
EUR 1,509 million (2015: 1,474 MEUR). The
cash flow was driven by the growth in operating
income and continued favorable development in
net working capital.
Creating stakeholder value
Our positive financial performance in recent
years has enabled us to generate stakeholder
value for our customers and suppliers, local
communities, employees and shareholders
alike.
Customers and suppliers
Our strategy ‘Winning with customers’ means
that everything we do focuses on helping
our customers succeed in their businesses.
Read more
about KONE’s financial
performance from our Annual
Review 2016 available at
kone.com/investors.We seek to build long-term relationships with
our suppliers and customers. Our supplier
relationships provide business opportunities
and employment for thousands of suppliers
globally. Read more about our supplier
management on p. 46-47.
Local communities
KONE is committed to operating as a responsible
corporate citizen in all the countries in which
we are present. We are committed to paying
all taxes that are legally due, and to meeting
all disclosure requirements in the countries
where we operate. Our objective is to ensure
predictability in all tax matters. In addition,
every transaction must have a solid business
rationale without compromising tax compliance
principles. The location of KONE’s group entities
is driven by business reasons, such as the
location of customers, suppliers, raw materials
and know-how. We insist on transparency in all
our activities, including our relationships with
tax authorities. KONE has been collaborating
with the Finnish Tax Authorities in promoting
tax transparency since 2015. KONE’s income
taxes globally amounted to EUR 307.7 (311.4)
million in 2016, with the ten largest countries by
sales accounting for 78% of the corporate taxes.
Income taxes of the Finnish KONE companies
totaled EUR 56.7 (37.2) million in 2016.
Employees
Our largest direct economic impacts come
from the employment opportunities we
provide. KONE is a global company with
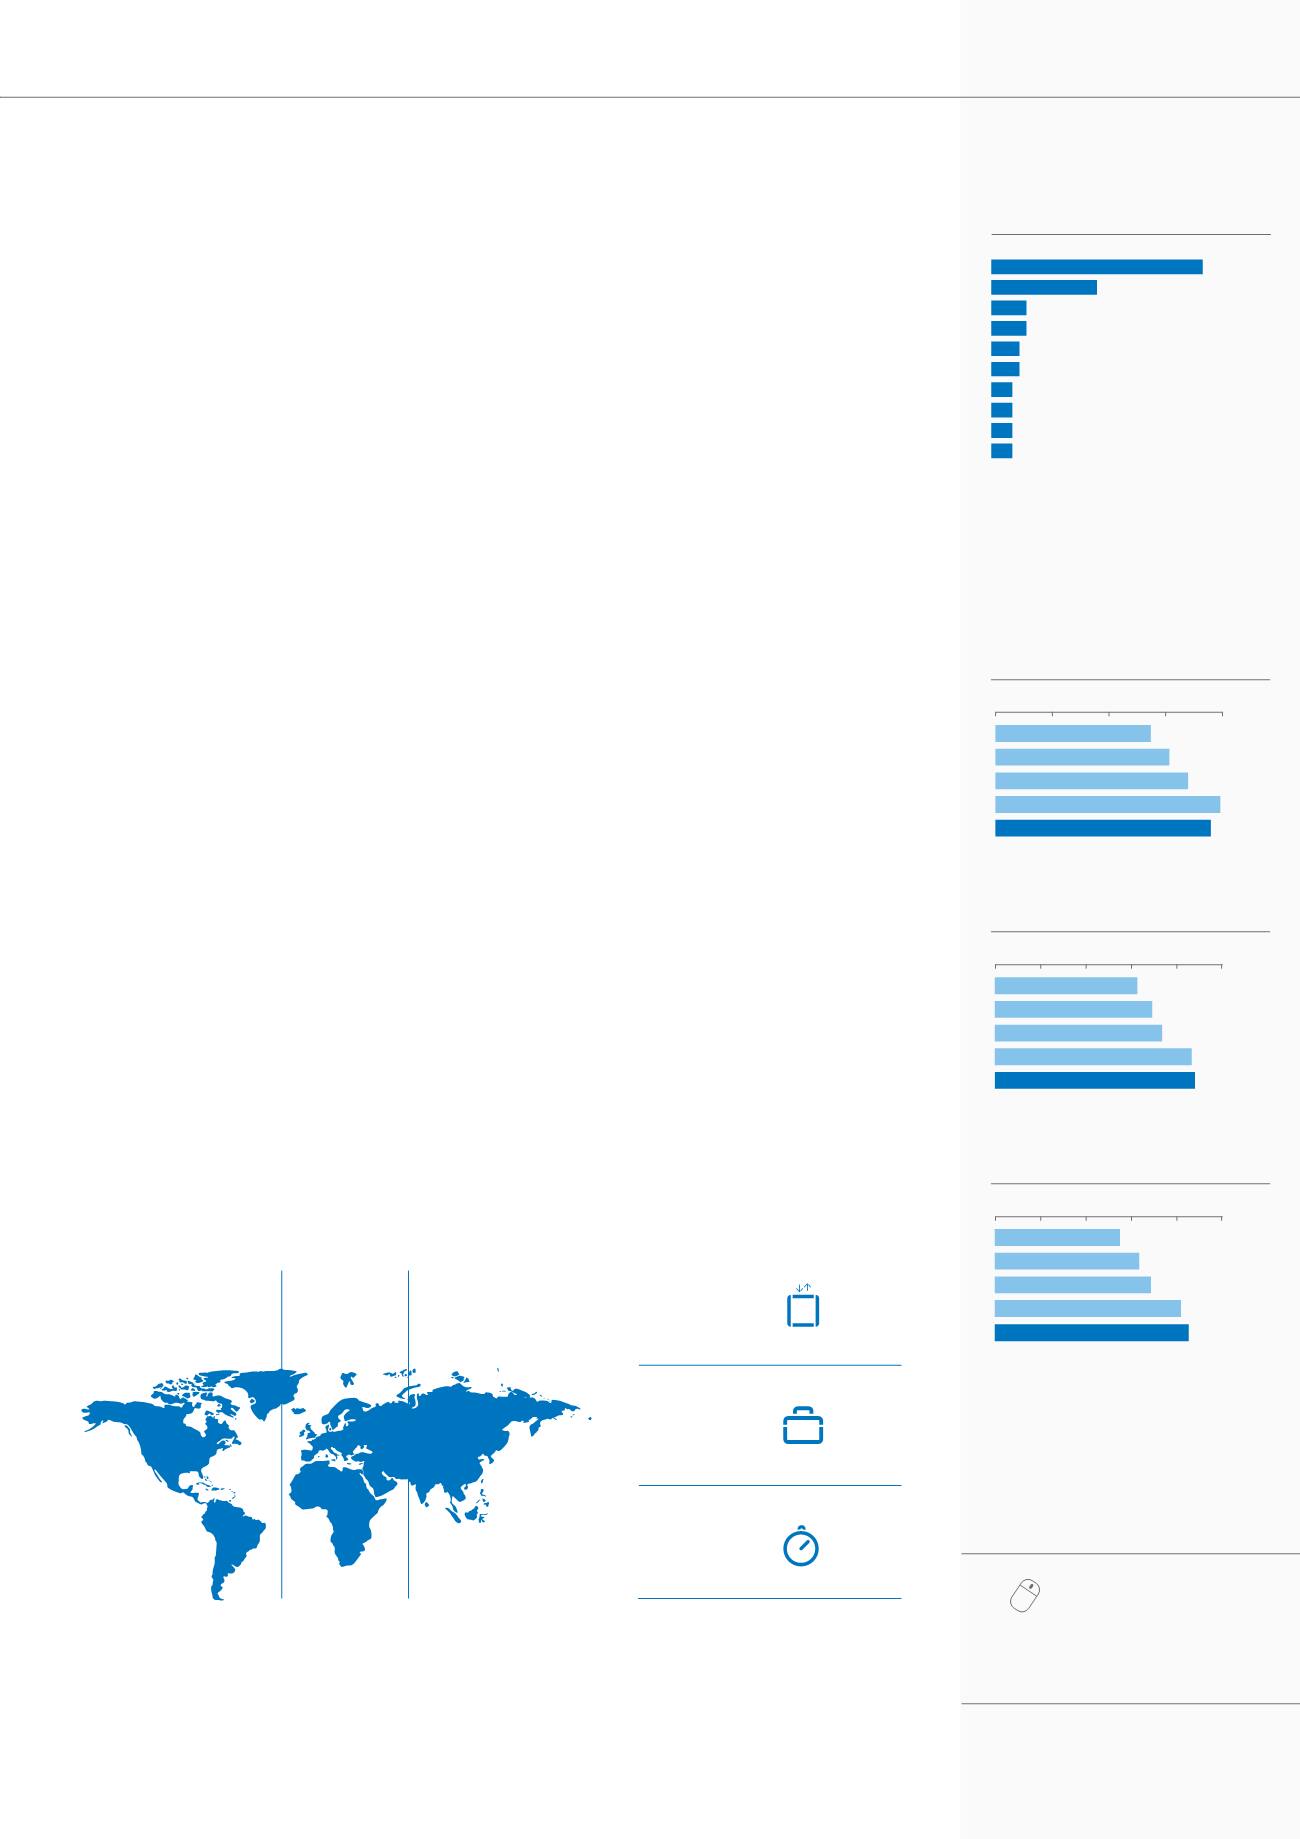
Operating income 2012-2016 (MEUR)
0 300 600 900 1,200 1,500
1,293
2015
2013
2014
2012
2016
829
953
1,036
1,241
*For a list of KONE’s top 10 countries by sales, please see page 40.
EMEA
40%
Americas
19%
Asia-Pacific
41%
Sales by market 2016
Sales by business 2016
New equipment
55%
Modernization
14%
Maintenance
31%
Our geographic regions are Europe, the Middle East and Africa (EMEA), Americas, and Asia-Pacific. The service business
accounts for 45% of KONE’s revenue, while the new equipment business represents the remaining 55%.
Orders received 2012-2016 (MEUR)
0 2,000 4,000 6,000 8,000
7,621
2015
2013
2014
2012
2016
5,496
6,151
6,813
7,959
0
Sales 2012-2016 (MEUR)
2,000 4,000 6,000 8,000 10,000
2015
2013
2014
2012
6,277
6,933
7,334
8,647
8,784
2016
10 biggest countries by sales, 2016
~30%
United States ~15%
France ~5%
Germany ~5%
Great Britain ~4%
Australia ~4%
Italy ~3%
Finland ~3%
India ~3%
Sweden ~3%
China