


 40 / 52

KONE 2016 | SUSTAINABILITY REPORT
ECONOMIC RESPONSIBILITY
40
Read more
about our economic performance
at
www.kone.com/investors.global processes and guidelines, but our
operations are at the same time very local.
In our subsidiaries, management and field
personnel are predominantly local. KONE had
over 52,000 employees in over 60 countries
at the end of 2016. In 2016, the largest KONE
countries by the number of employees were
China, the United States and India. Read more
about our people on p. 34-37.
Shareholders
KONE’s strong financial performance
has enabled increasing dividends to our
shareholders. In total, KONE distributed
approximately EUR 795 million in dividends
for the financial year 2016. Also with a longer-
term perspective, our track record on dividend
distribution has been sustainable. During the
last ten years the, dividends have grown by
20% per year on average. KONE had over
57,000 shareholders at the end of December
2016. (Dec. 2015: over 56,000 shareholders)
Ensuring added value in the future
KONE has three long-term financial targets:
growing faster than the market, achieving an
EBIT margin of 16%, and improving working
capital rotation. We have achieved two of
these three targets: KONE has grown faster
than the market in recent years, and we
have improved our working capital rotation
at the same time. For the 16% EBIT margin,
no target date has been set. With our life-
cycle business model, the short-term focus
is on growing absolute EBIT while achieving
improved relative profitability over time
with growth and productivity gains. KONE’s
philosophy is to continuously develop the
business with a long-term outlook. We are
focused on maintaining our challenger
attitude and we are constantly developing our
competitiveness in order to strengthen our
position as one of the global leaders in the
elevator and escalator industry.
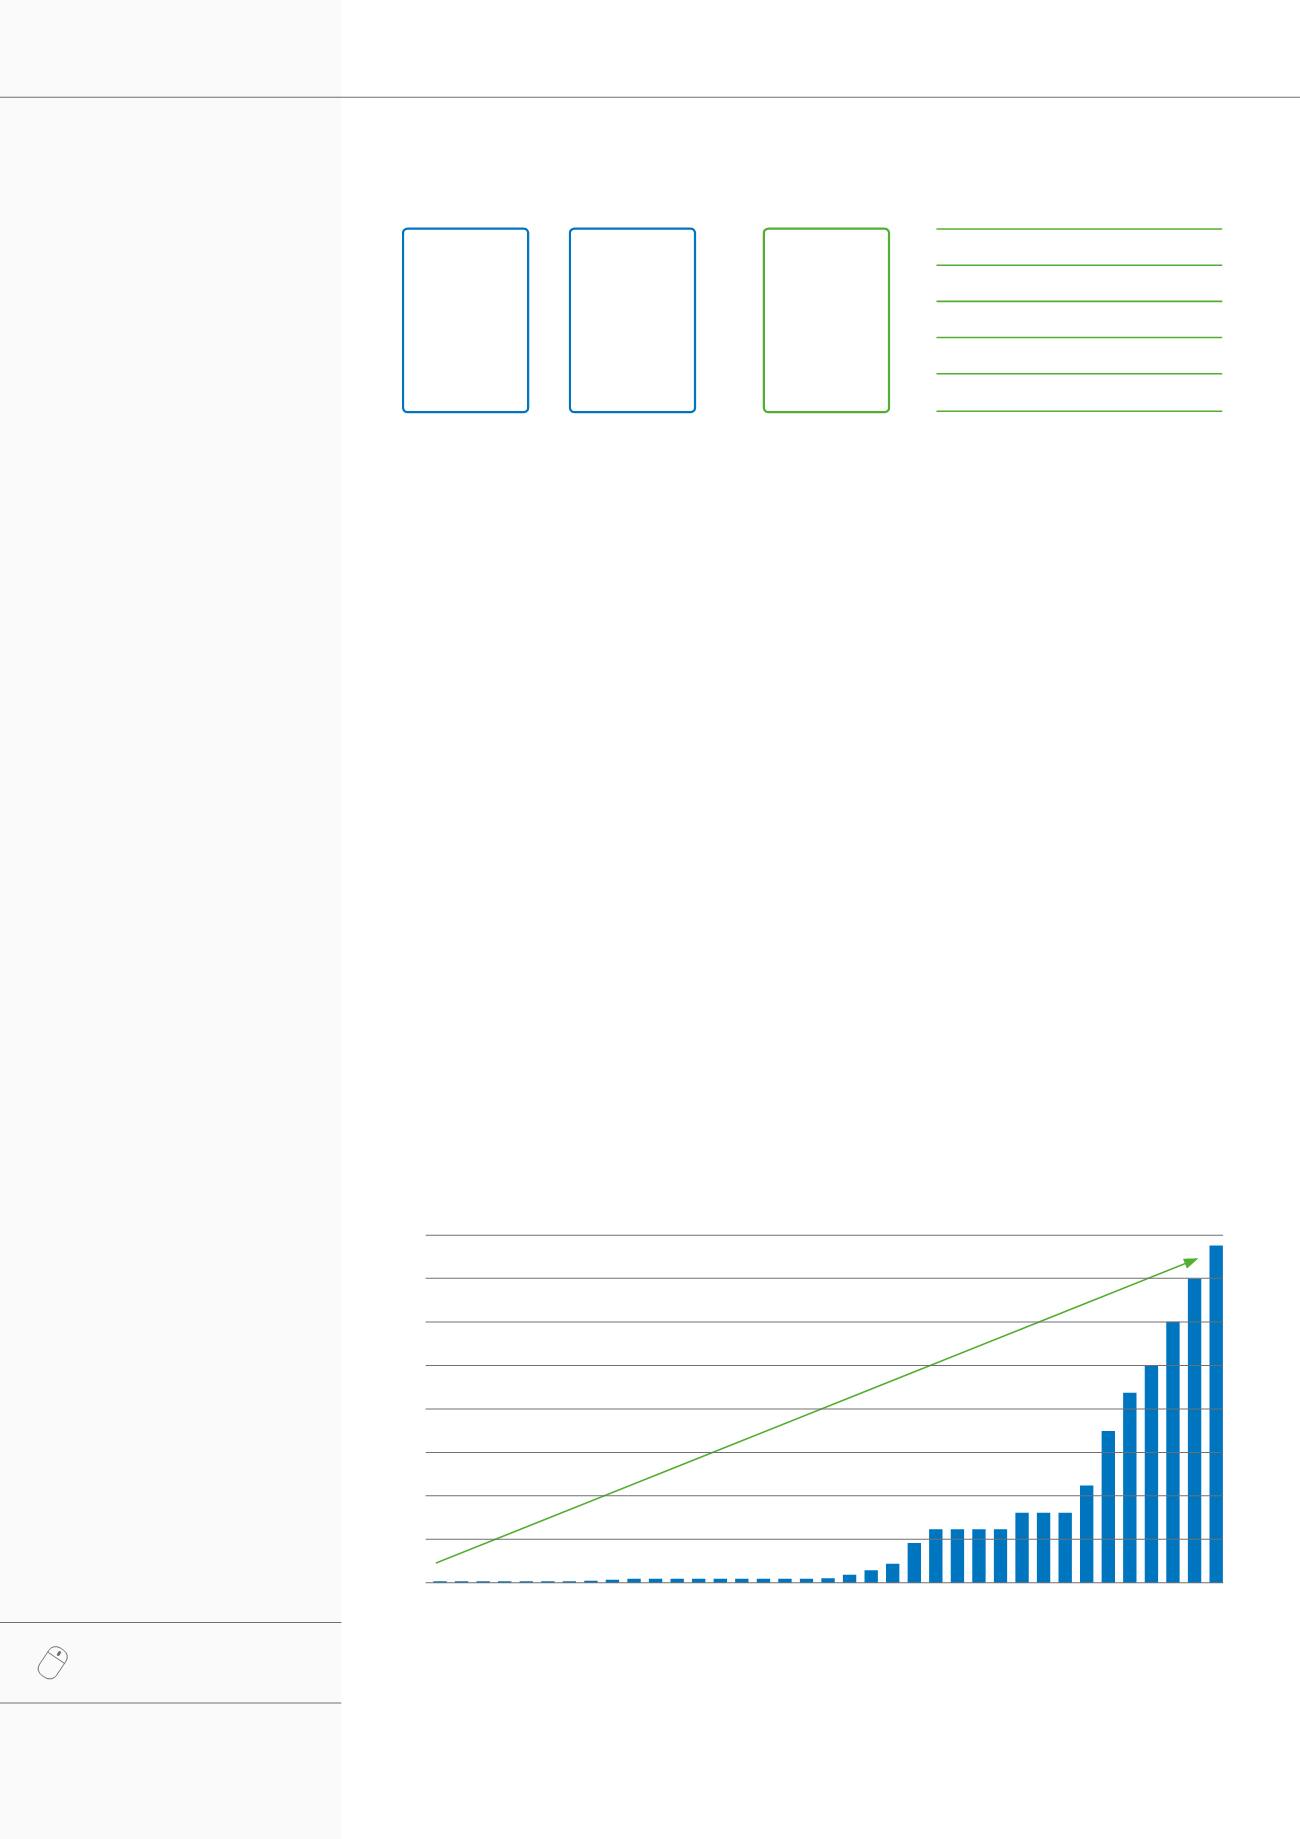
1)
Note: Includes the basic dividend. Adjusted for share splits in 1999 (1:3), 2002 (1:3), 2005 (1:2), 2008 (1:2) and 2013 (1:2).
1 EUR= 5.9 FIM; not adjusted to constant exchange rate. Additional extraordinary dividends: for 2009, a double dividend was
paid; for 2011, an extraordinary dividend of EUR 0.75 was paid and for 2012, an extraordinary dividend of EUR 0.65 was paid.
2)
Compound annual growth rate
KONE’s largest individual
shareholder is Antti Herlin,
Chairman of KONE’s Board of
Directors, who controls over 20%
of the share capital and over 60%
of votes.
For KONE’s domestically registered
major shareholders, see monthly
updated list on our website.
Split-adjusted dividend per class B share, EUR, 1980–2016
1
1.6
1.4
1.2
1.0
0.8
0.6
0.4
0.2
0.0
CAGR
2
1980–2016
+15%
-80 -81 -82 -83 -84 -85 -86 -87 -88 -89 -90 -91 -92 -93 -94 -95 -96 -97 -98 -99 -00 -01 -02 -03 -04 -05 -06 -07 -08 -09 -10 -11 -12 -13 -14 -15 -16
Customers
8,784
(8,647)
MEUR
Suppliers
4,857
(4,960)
MEUR
Added value
3,927
(3,687)
MEUR
- =
Stakeholders
KONE’s economic impacts in 2016
Employees
1,962
(1,825) MEUR
Creditors
-36
(-122) MEUR
Public sector
979
(932) MEUR
Shareholders
795
(718) MEUR
Economic value
retained in the company
226
(334 MEUR
(2015 figures in brackets)
LONG-TERM FINANCIAL TARGETS
GROWTH:
Faster than the market
PROFITABILITY:
16% EBIT margin
CASH FLOW:
Improved working capital
rotation
Our positive financial
performance in recent
years has enabled us to
generate stakeholder
value for our customers
and suppliers,
local communities,
employees and
shareholders alike.