


 6 / 50

KONE 2013 | CORPOR ATE RESPONSIBILIT Y REPORT
KEY FIGURES 2013
6
Key financial figures
2012
2013 change, %
Orders received
MEUR
5,496.2
6,151.0
11.9%
Order book
MEUR
5,050.1
5,587.5
10.6%
Sales
MEUR
6,276.8
6,932.6
10.4%
Operating income
MEUR
828.7
1)
953.4
15.1%
Operating income
% 13.2
1)
13.8
Cash flow from operations
(before financing items and taxes)
MEUR
1,070.8
1,213.1
Net income
MEUR
611.0
713.1
Basic earnings per share
EUR
1.17
1.37
Interest-bearing net debt
MEUR
-574.0
-622.0
Total equity/total assets
%
47.1
43.7
Gearing
%
-31.3
-36.1
R&D expenditure
MEUR
86.1
96.5
1)
Excluding a MEUR 37.3 one-time cost related to the support function development and cost adjustment programs.
Key figures 2013
8
7
6
5
4
3
2
1
0
2007 2008 2009 2010 2011 2012 2013
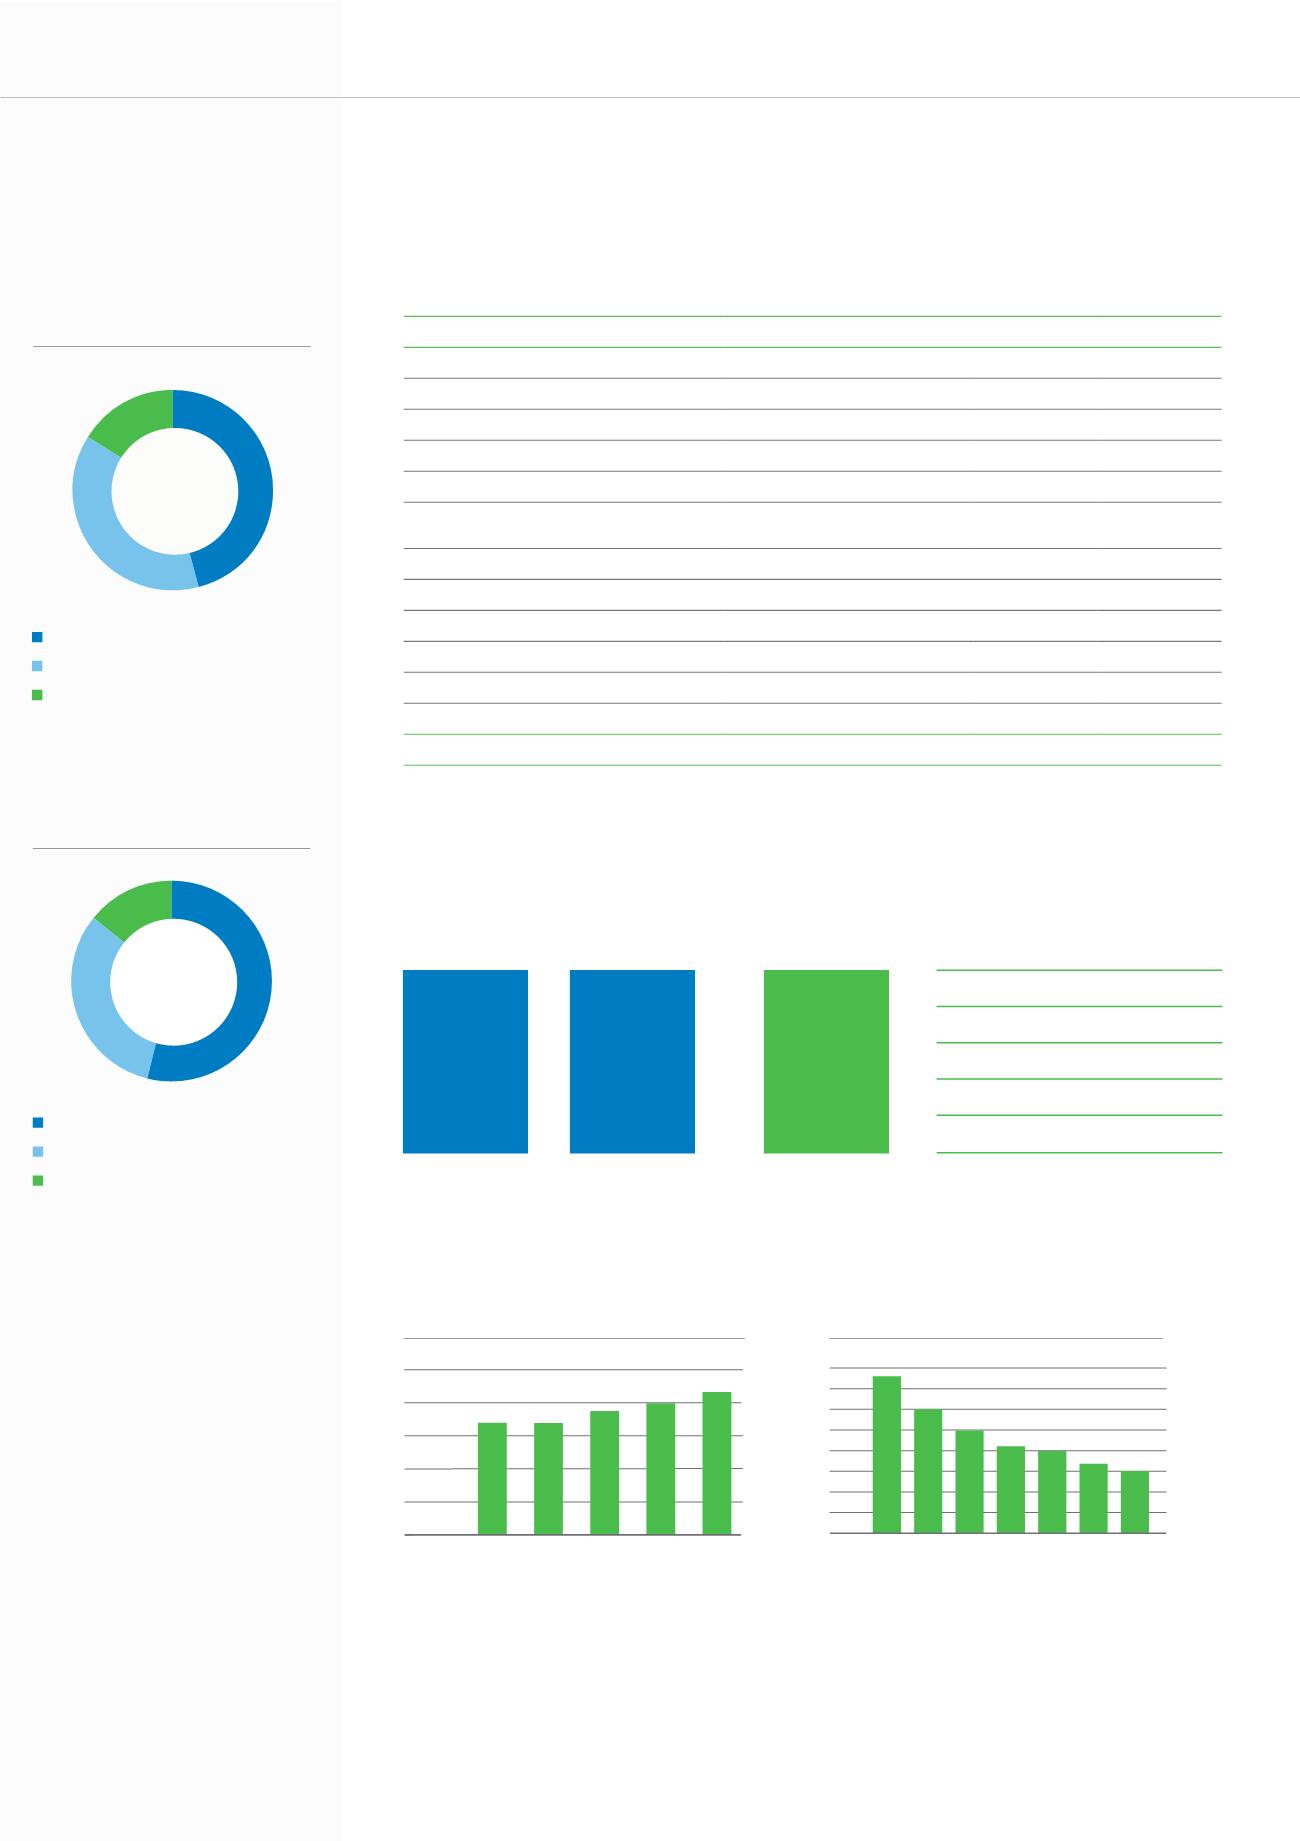
IIFR development*
*Industrial Injury Frequency Rate. KONE tracks the
number of lost time injuries of one day or more, per
million hours worked, as a key performance indicator.
The IIFR covers KONE’s own employees.
Sales by market, 2013
46%
38%
16%
EMEA 46% (49%)
Asia-Pacific 38% (35%)
Americas 16% (16%)
(2012 figures in brackets)
Sales by business, 2013
54%
32%
14%
New equipment 54% (50%)
Maintenance 32% (34%)
Modernization 14% (16%)
(2012 figures in brackets)
2009
2010 2011
2012 2013
Number of employees, end of year
50 000
40 000
30 000
20 000
10 000
0
Customers
6,933
(6,277)
MEUR
Suppliers
3,995
(3,610)
MEUR
Added value
2,938
(2,667)
MEUR
- =
Stakeholders
KONE’s economic impacts in 2013
Employees
1,473
(1,375) MEUR
Creditors
-6
(-8) MEUR
Public sector
758
(693) MEUR
Shareholders
512
(781) MEUR*
Economic value
retained in the company
201
(-174) MEUR
(2012 figures in brackets)
*Dividends paid for the financial year. The figure for the financial year 2012 includes a special dividend.