


 7 / 50

KONE 2013 | CORPOR ATE RESPONSIBILIT Y REPORT
KEY FIGURES 2013
7
Employees by job category, 2013
Maintenance and
modernization 56% (57%)
New equipment sales and
istallation 25% (25%)
Manufacturing 10% (9%)
Administration, IT, R&D 9% (9%)
(2012 figures in brackets)
56%
25%
10%
9%
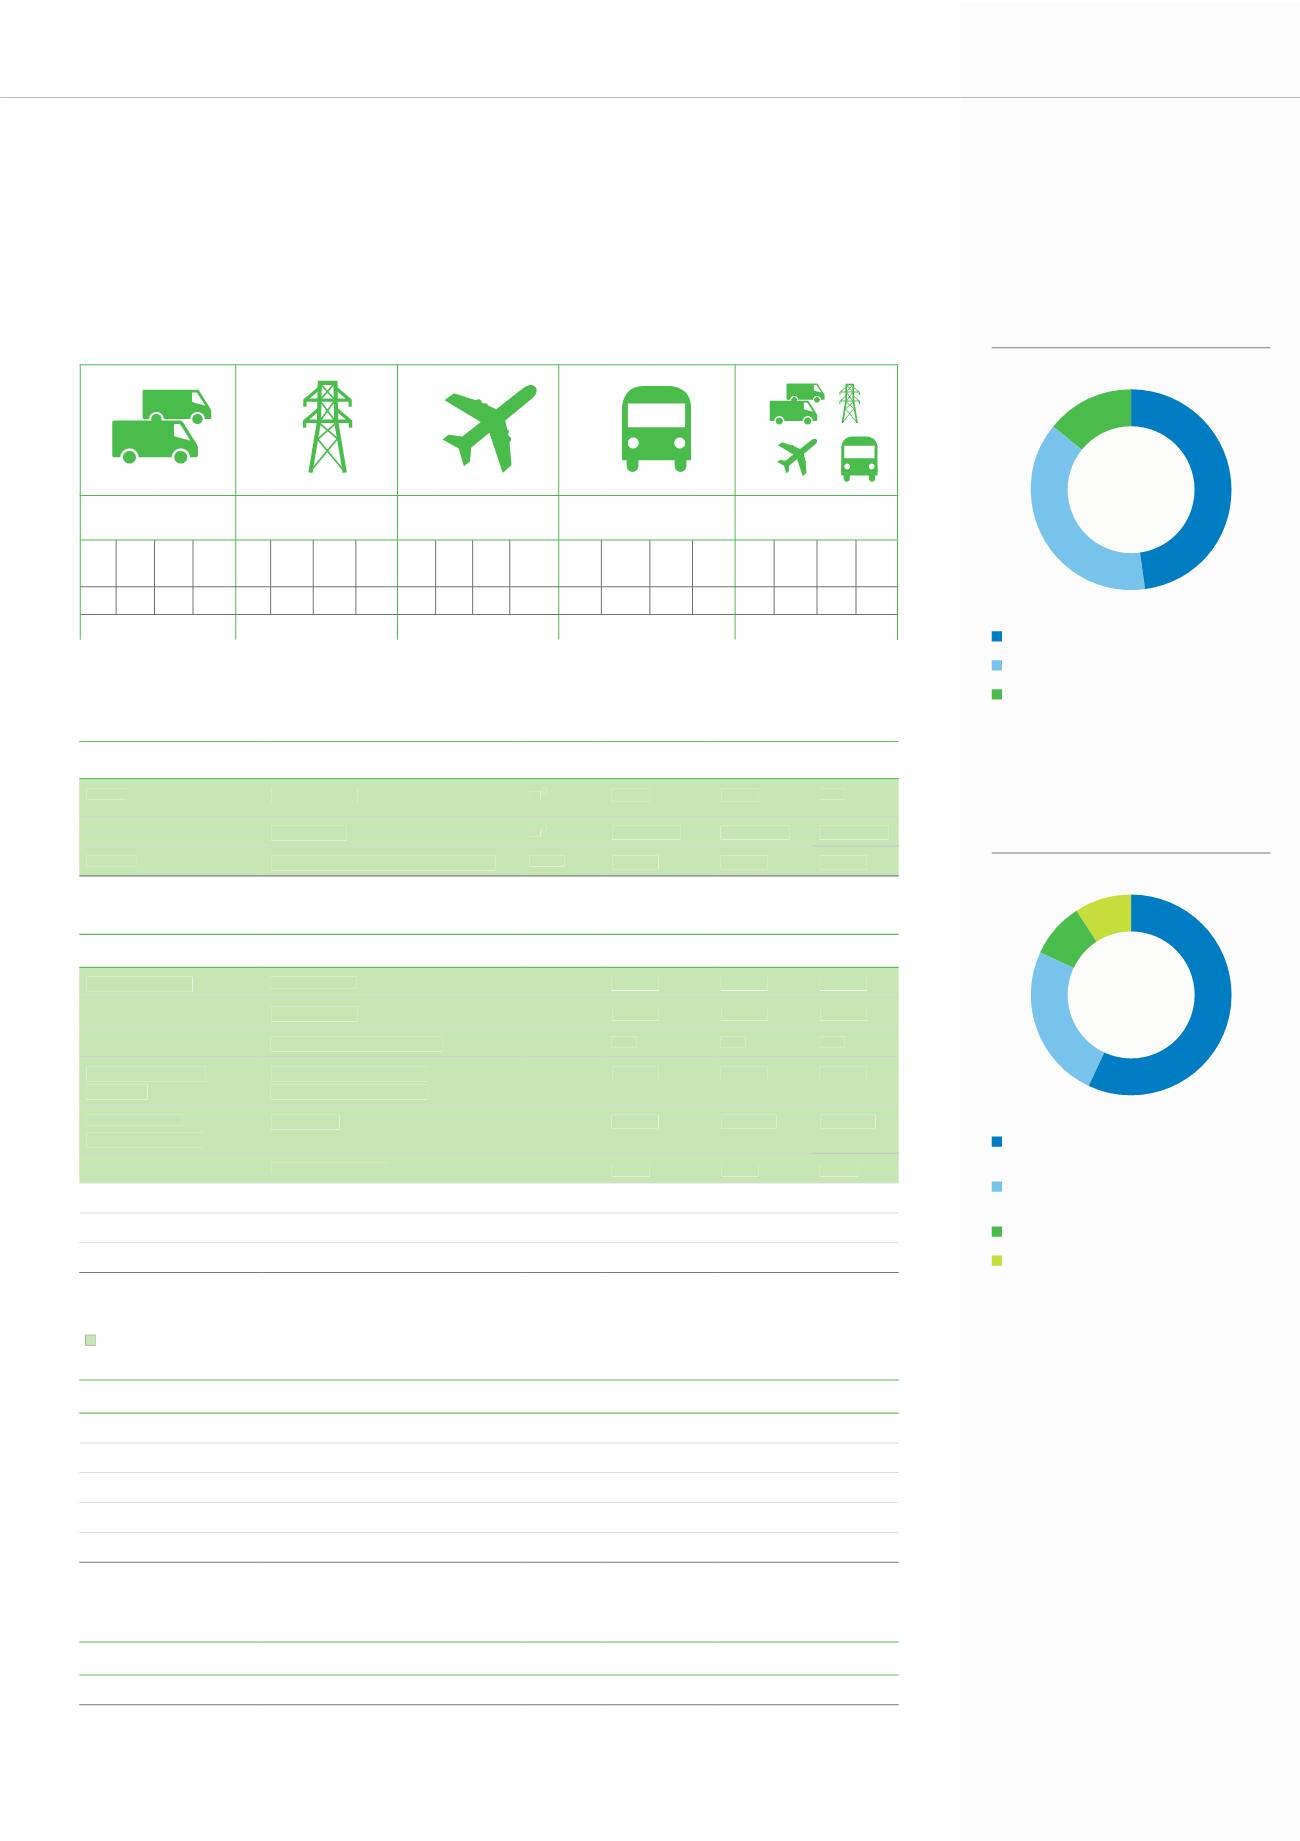
Employees by market, 2013
EMEA 47% (48%)
Asia-Pacific 40% (38%)
Americas 13% (14%)
(2012 figures in brackets)
Relative operational carbon footprint
* Restated
** Restated to include GiantKONE and India
Data for vehicle fleet, electricity, business air travel and logistics assured externally.
Vehicle fleet
(Scope 1)
Electricity
(Scope 2)
Business air travel
(Scope 3)
Logistics
(Scope 3)
Overall operations
2011 2012 2013 YoY 2011 2012 2013 YoY 2011 2012 2013 YoY 2011 2012 2013 YoY 2011 2012 2013 YoY
85.6 83.1* 77.4 -6.9% 898 1,055 1,027 -2.7% 226 182 226
+24.2%
1,408 1,088** 1,039 -4.5% 47.4 45.8* 44.2 -3.5%
kgCO
2
e / Unit in service kgCO
2
e / Headcount
kgCO
2
e / Headcount
kgCO
2
e / Unit
kgCO
2
e / KEUR Sales
Energy consumption
Units
2011
2012 2013
Direct
Heating fuels
m
3
2,500
1,300
800
Natural gas
m
3
3,337,000 5,631,000 5,927,000
Indirect
Electricity, including district heat* MWh
76,934
92,356
92,986
*2012 restated
Carbon footprint of KONE’s operations, tCO
2
e
2011
2012 2013
Direct (scope 1)
Vehicle fleet*
88,500
88,400
86,200
Heating fuels
13,000
14,000
13,000
Gases for cooling systems
400
900
800
Indirect electricity
(scope 2)
Electricity consumption
(including district heat)
32,000
42,000
45,000
Other relevant
indirect (scope 3)
Logistics**
95,900
116,800 130,800
Business air travel
8,000
7,200
9,800
Employee commuting
12,000
18,000
19,000
Waste
500
500
600
Total*
250,300
287,800 305,200
*2012 restated
**2011 excluding GiantKONE in China
Scope 1, scope 2, and scope 3 logistics and business air travel data assured by Ecobio Oy
Waste, tonnes
2011
2012 2013
Recycled waste**
18,400
20,700
24,300
Incinerated waste
2,300
2,700
2,300
Landfill waste*
2,700
2,400
3,200
Hazardous waste
600
700
900
Total**
24,000
26,500
30,700
*2012 restated
**2011 and 2012 restated
Water consumption
2011
2012 2013
Total
m
3
270,000
390,000 440,000
47%
40%
13%