


 6 / 52

KONE 2016 | SUSTAINABILITY REPORT
SUSTAINABILITY HIGHLIGHTS IN 2016
6
Key financial figures
2015
2016 change, %
Orders received
MEUR
7,959
7,621
-4.2%
Order book
MEUR
8,201
8,952
7.7%
Sales
MEUR
8,647
8,784
1.6%
Operating income
MEUR
1,241
1,293
4.2%
Operating income margin
%
14.4
14.7
Cash flow from operations
(before financing items and taxes)
MEUR
1,474
1,509
Net income
MEUR
1,053.1
1,023
Basic earnings per share
EUR
2.01
2.00
Interest-bearing net debt
MEUR
-1,512.6
-1,687.6
Total equity/total assets
%
45.4
46.8
Gearing
%
-58.7
-60.4
R&D expenditure
MEUR
121.7
140.5
SUSTAINABILITY HIGHLIGHTS IN 2016
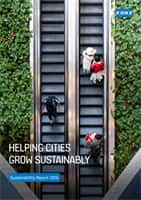
Sales by business, 2016
55%
31%
14%
New equipment 55% (57%)
Maintenance 31% (31%)
Modernization 14% (12%)
(2015 figures in brackets)
Number of employees, end of year
Customers
8,784
(8,647)
MEUR
Suppliers
4,857
(4,960)
MEUR
Added value
3,927
(3,687)
MEUR
- =
Stakeholders
KONE’s economic impacts in 2016
Employees
1,962
(1,825) MEUR
Creditors
-36
(-122) MEUR
Public sector
979
(932) MEUR
Shareholders
795
(718) MEUR
Economic value
retained in the company
226
(334 MEUR
(2015 figures in brackets)
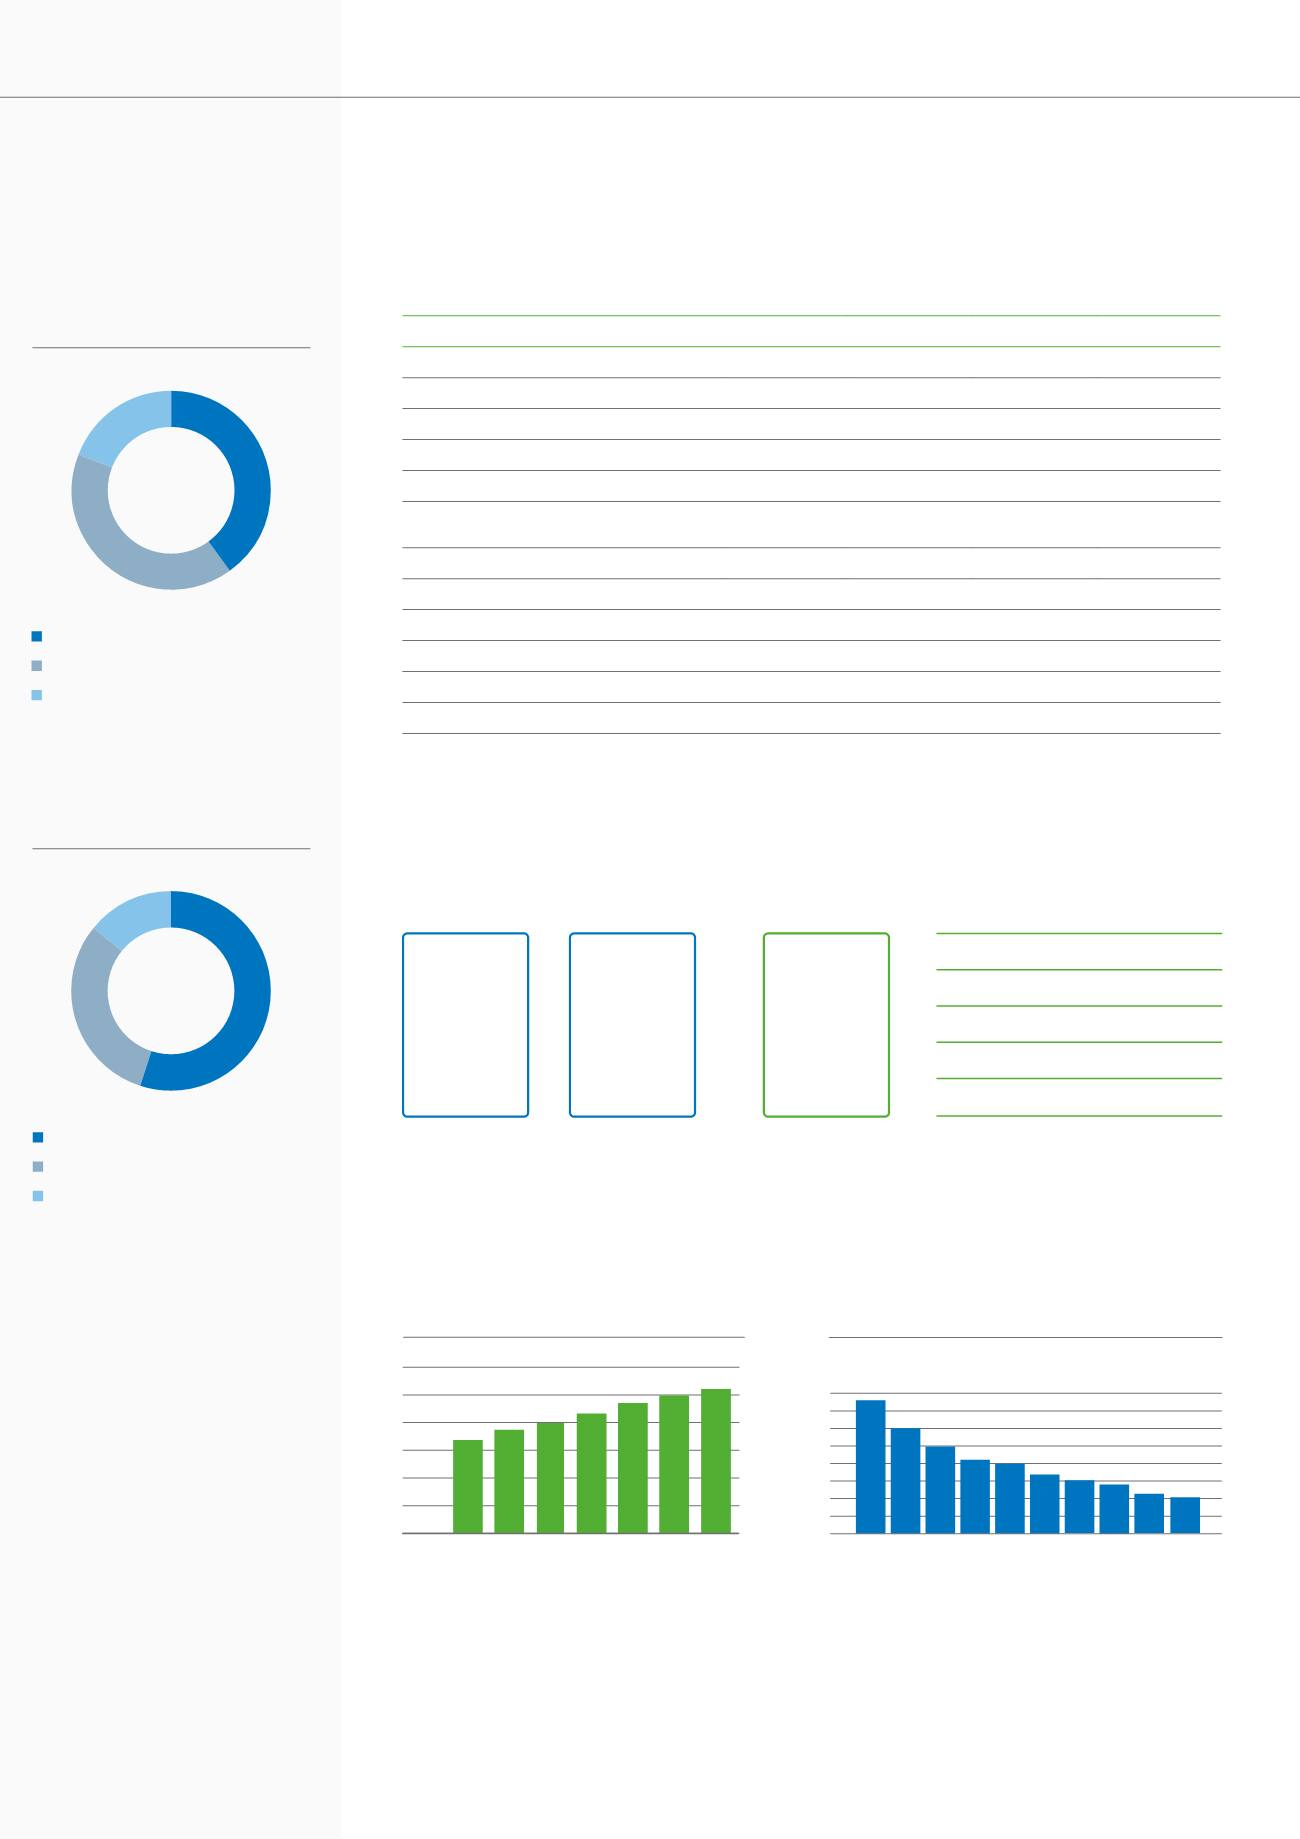
Industrial Injury Frequency Rate
development among KONE employees
KONE tracks the number of lost time injuries of one day or more,
per million hours worked, as a key performance indicator. The
IIFR covers KONE’s own employees.
2007
8
7
6
5
4
3
2
1
0
7.5
2008
6.0
2009
5.2
2010
4.3
2011
4.1
2012
3.4
2013
3.0
2014
2.8
2015
2.3
Sales by market, 2016
EMEA 40% (39%)
Asia-Pacific 41% (44%)
Americas 19% (17%)
(2015 figures in brackets)
40%
41%
19%
2013
2012
2011
2010
2014 2015
60,000
50,000
40,000
30,000
20,000
10,000
0
2016
2016
2.1
33,755
37,542 39,851
43,298
47,064 49,734 52,152