


 7 / 52

KONE 2016 | SUSTAINABILITY REPORT
SUSTAINABILITY HIGHLIGHTS IN 2016
7
Energy consumption
Unit
2014 2015 2016
Direct
Heating and vehicle fleet fuels
(heating oil, natural gas, petrol,
diesel, biodiesel)
MWh
404,200*
413,000* 423,000
Indirect
Electricity
MWh
80,000*
79,900* 78,900
District heat
MWh
15,900
15,100 15,900
*Restated
Carbon footprint of KONE’s operations, tCO
2
e
2014 2015 2016
Direct energy (scope 1) Vehicle fleet
85,800
88,500 92,000
Heating fuels
12,600*
12,300* 11,100
Cooling gases
1,400
1,900
1,600
IIndirect energy
(scope 2)
Electricity consumption
and district heat**
40,900
39,800* 36,900
Other relevant
indirect (scope 3)
Logistics
141,000*
147,700* 149,000
Business air travel
17,900
18,000* 18,600
Waste
2,300
2,300*
1,800
Total
301,900 310,500 311,000
*Restated **Calculated using market-based method , location-based value for 2016 is 42,800 tCO
2
e
Waste, tonnes
2014 2015 2016
Recycled waste
16,800*
16,100* 17,500
Incinerated waste
2,200
2,200
2,900
Landfill waste
2,700
3,000
1,900
Hazardous waste
900*
800
800
Total
22,600
22,100 23,100
*Restated
Water consumption
2014 2015 2016
Total
m
3
390,000 390,000 350,000
Scope 1, scope 2, and scope 3 logistics and business air travel data assured by Mitopro Oy
Employees by market, 2016
Americas: 14% (13%)
Asia-Pacific: 45% (45%)
EMEA: 41% (42%)
(2015 figures in brackets)
14%
41%
45%
Employees by job category, 2016
Maintenance and
modernization 56% (56%)
New equipment, sales and
installation 26% (26%)
Manufacturing 9% (9%)
Administration, IT and R&D
9% (9%)
(2015 figures in brackets)
56%
26%
9%
9%
1,200
1,050
900
750
600
450
300
150
0
1,200
1,050
900
750
600
450
300
150
0
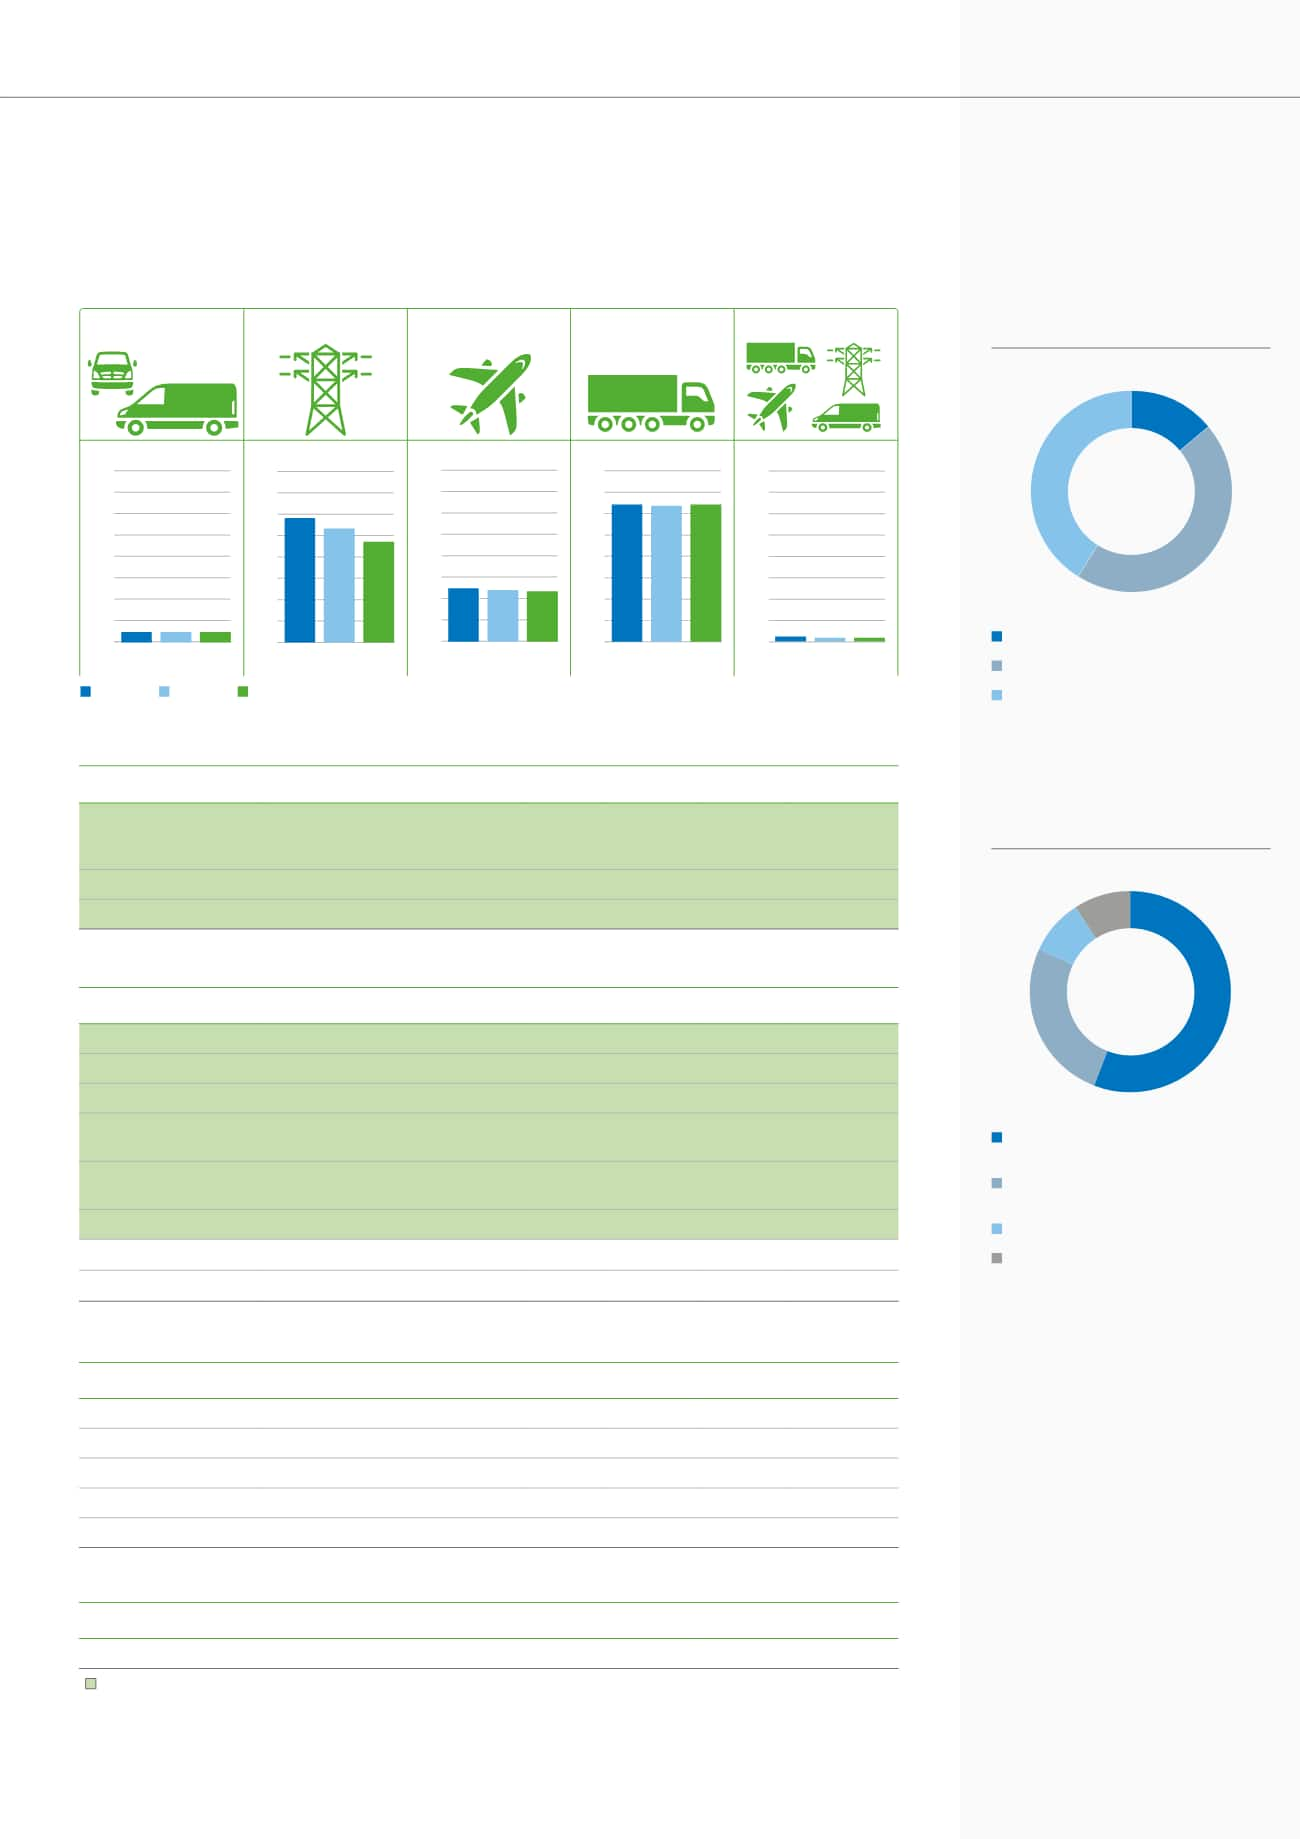
Relative operational carbon footprint
Data assured externally
kgCO
2
e / Unit in service
kgCO
2
e / Headcount
kgCO
2
e / Headcount
kgCO
2
e / Unit
tCO
2
e / MEUR Sales
Vehicle fleet
(Scope 1)
Electricity (Scope 2)
Business air travel
(Scope 3)
Logistics (Scope 3)
Overall operations
2014
2015
2016
73.5 71.4 71.4
1,200
1,050
900
750
600
450
300
150
0
870
800
708
380 362 357
1,200
1,050
900
750
600
450
300
150
0
961 958 967
41.2
35.9
35.2
1,200
1,050
900
750
600
450
300
150
0